Microphone Specifications Chart: Sensitivity, SPL, Self-Noise and Frequency Response
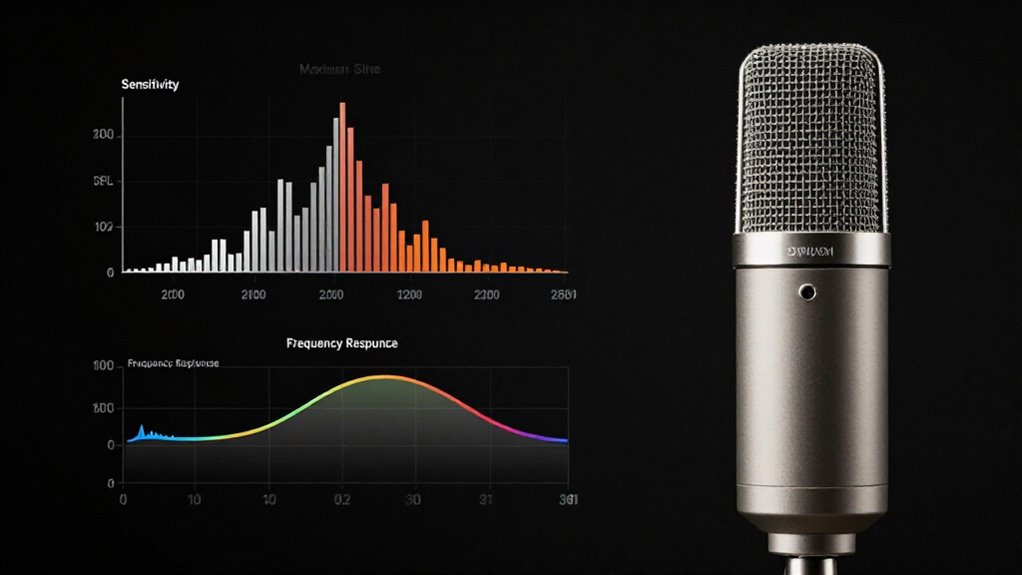
Compare microphone sensitivity at 1 kHz, 1 Pa (94 dB SPL): higher mV/Pa or less-negative dBV/Pa needs less preamp gain. For quiet work, choose self-noise below 15 dBA; 7 dBA is exceptionally quiet, while 25 dBA suits louder sources.
Match maximum SPL and its THD criterion to placement; close snare work needs about 130 dB SPL or more. Check frequency-response tolerance, polar plots, phantom requirements, and rear rejection next to interpret real-world performance with confidence in practice.
Compare 1 kHz Sensitivity Ratings
To compare 1 kHz sensitivity ratings, use values measured on-axis at 1 pascal (94 dB SPL) and express them in the same unit: mV/Pa or dBV/Pa. These units describe the same output level. A higher mV/Pa figure equals a less-negative dBV/Pa value, indicating greater sensitivity. For a fixed sound pressure, a more sensitive microphone delivers more voltage, so your preamp requires less gain.
Don’t treat a nominal value as exact without checking its tolerance. For example, 10 mV/Pa ±2 dB produces approximately 7.9 to 12.6 mV at 94 dB SPL. Verify that each specification uses identical reference pressure, test frequency, on-axis orientation, and stated measurement conditions. Otherwise, the numerical difference may reflect test methodology rather than a meaningful output-voltage difference between microphones.
Studio Condenser Specification Benchmarks
Studio condensers typically deliver higher sensitivity than dynamic microphones, so they produce more output voltage at 1 kHz and need less preamp gain. Use these benchmarks when you evaluate a studio model:
| Spec | Practical benchmark |
|---|---|
| Self-noise | ≤16 dB(A); <15 is extremely quiet |
| Maximum SPL | 120 dB for vocals; ≥130 for loud sources |
| Response | ±2 dB; confirm distance for directional tests |
| Sensitivity | Check stated tolerance: ±2 dB materially changes output. |
At 1 kHz, compare sensitivity in mV/Pa and confirm its tolerance. A 10 mV/Pa rating ±2 dB spans roughly 7.9–12.6 mV/Pa. You should compare maximum SPL with its stated THD criterion; limits aren’t directly equivalent otherwise. For directional response, verify measurement distance and conditions before you judge deviations. This prevents misleading comparisons between published specifications.
dBV, dBu, and Pascals
Microphone sensitivity connects acoustic pressure to electrical output: manufacturers commonly measure it at 1 kHz with 1 Pa of pressure, which equals 94 dB SPL. You can read this reference point as the condition under which sensitivity is stated.
When a specification uses mV/Pa, it gives output voltage per pascal. A value of 10 mV/Pa equals 0.01 V/Pa, or approximately −40 dBV/Pa. dBV references voltage to 1 V: 0 dBV equals 1 V, while negative figures indicate lower voltages. Therefore, you can compare mV/Pa and dBV/Pa directly after conversion. You should distinguish the acoustic input unit, Pa, from electrical output units; they quantify different sides of the transduction relationship.
Self-Noise Ranges: 7–25 dBA
You assess self-noise as the microphone’s A-weighted RMS noise floor in dBA, where lower values preserve more dynamic range. For quiet studio sources, choose models below 15 dBA; 15 to 20 dBA suits many general recording tasks. A 25 dBA rating can remain practical for loud sources, but its noise becomes more apparent on soft material and high-gain recordings.
Understanding dBA Self-Noise
Self-noise, stated in dBA, quantifies the A-weighted RMS noise that a microphone’s diaphragm and electronics generate without an external signal. You can interpret this specification as the ambient sound-pressure level that would create an equivalent output in an otherwise noise-free microphone. Therefore, it expresses internal noise as an acoustic reference.
The A-weighting curve attenuates low-frequency energy to approximate human hearing, so dBA doesn’t represent unweighted noise across the full spectrum. Within a 7 to 25 dBA range, lower numbers indicate less intrinsic noise. A value below 15 dBA is generally extremely low; about 16 dBA or less is typically acceptable. At roughly 25 dBA, you may notice the microphone’s noise more readily when recording quiet sources or sparse passages. Compare dBA values under matching measurement conditions carefully.
Low-Noise Studio Microphones
For low-noise studio work, a 7 to 25 dBA self-noise specification separates microphones suited to quiet, high-gain recordings from those whose internal noise may become audible. Self-noise is the microphone’s internally generated, A-weighted RMS noise level; lower values indicate quieter operation. At the 7 dBA end, you retain more usable dynamic range for quiet low-SPL sources.
As the figure rises toward 25 dBA, the noise floor can emerge when you apply substantial preamp gain or compress the recording. Evaluate the published number as equivalent input noise: it represents the acoustic SPL that an ideal noiseless microphone would need to produce the same output noise. Compare only identically A-weighted specifications, since A-weighting de-emphasizes low-frequency energy to approximate hearing. Below 15 dBA generally qualifies as extremely low self-noise.
Typical 15–20 dBA Range
A 15 to 20 dBA self-noise rating places a microphone in the typical low-noise range, though performance varies meaningfully across that span. It indicates the microphone’s internally generated noise, expressed as an equivalent A-weighted sound-pressure level. Manufacturers commonly determine this figure in a soundproof chamber over 20 Hz to 20 kHz, applying A-weighting to reflect auditory sensitivity.
You should interpret lower values as quieter electronics and capsules: approximately 15 dBA is very low, whereas 16 dBA or below is often acceptable for demanding work. At 20 dBA, the microphone may still suit many sources, but its noise floor reduces your margin when you capture quiet material. Evaluate this specification independently from room noise, preamp noise, and source level. It doesn’t indicate whether your recording environment or connected equipment is suitably quiet in practice.
High Self-Noise Tradeoffs
Higher self-noise imposes a direct tradeoff: as a microphone rises from roughly 7 dBA toward 25 dBA, its internal hiss consumes more of the level range available for quiet sources. This noise establishes a floor beneath detail, reducing the microphone’s usable dynamic range before its noise becomes audible.
You’ll generally find figures below 15 dBA extremely quiet, while 16 dBA or less remains acceptable for many applications. At the upper end, near 25 dBA, substantial preamp gain can expose persistent hiss and obscure low-level information. You shouldn’t assess the specification in isolation, however. A low-noise microphone can’t remove ambient noise already present in your room. Compare its A-weighted self-noise with your recording environment, then determine whether the remaining noise floor supports the detail you need.
Matching Noise To Sources
Match microphone self-noise to the quietest source and environment you need to capture, because its internal noise floor can mask detail once you apply gain. Treat 7 dB(A) as an extremely quiet specification for close, low-level material, such as delicate ambience or faint acoustic detail. Aim below 15 dB(A) when you record quiet dialogue, soft instruments, or sparse environmental sound; this range leaves useful margin before microphone hiss becomes apparent.
Ratings up to roughly 16 dB(A) work for many sessions when the room’s ambient noise exceeds the microphone’s contribution. At 25 dB(A), however, hiss can emerge during pauses and under compression or post-production gain. You should prioritize a lower-noise model whenever source level and background noise are both low. Louder sources can mask it.
Match Max SPL to Sources
Headroom determines whether a microphone captures transient peaks cleanly or adds audible distortion. Match its maximum SPL rating to your source’s expected peak level, rather than its average level. For dialogue and singing, about 120 dB SPL capacity commonly provides an appropriate margin; air shows, jet engines, and similarly extreme sources may demand 130 dB SPL or more.
Verify the rating’s distortion criterion before comparing models. Maximum SPL often denotes 1% THD, while an acoustic overload point can indicate a less stringent threshold, such as 10% THD. Placement also changes the requirement: moving from one foot to three inches can increase SPL by roughly 20 dB. Consequently, close-miked loud instruments need greater capacity. Leave margin for spikes, because exceeding the distortion-free limit damages peaks.
Phantom Power and Pad Limits
Power requirements and attenuation controls affect whether a microphone operates correctly and whether the following preamp overloads. Before recording, verify that your condenser matches the available phantom supply.
Most models require a nominal 48 V, but some specify 24 V or 12 V. DPA pre-polarized condensers use this power for their internal preamp rather than capsule polarization. You can leave phantom enabled on other channels when using modern dynamic microphones.
Use a pad when level, not capsule tolerance, threatens the microphone output stage or preamp. The pad attenuates signal voltage; it doesn’t raise maximum SPL or improve the microphone’s distortion limit. Compare source with SPL and THD ratings: 120 dB SPL suits dialogue and singing, whereas louder sources require 130 dB SPL or higher.
Close-Miking a Snare Drum
Close-miking a snare exposes the microphone to high SPL peaks and abrupt transients, so choose a model rated around 130 dB SPL or higher for loud playing. Verify the distortion criterion behind that figure: one manufacturer may quote maximum SPL at 0.5% THD, another at 1%, making unlike ratings poor comparisons.
Leave margin for strike peaks, because overload clips transients and introduces harmonics even when average level appears acceptable. Don’t treat sensitivity as an SPL-handling rating; it determines preamp gain, so a lower-output microphone can still tolerate intense hits.
Use response curves to predict attack, body, and ring, then inspect both on-axis and off-axis plots. Off-axis irregularities can alter the captured balance when cymbals, toms, and other nearby sources enter the microphone capsule.
Troubleshoot Unbalanced-Cable Hum
Unbalanced microphone cables readily pick up mains hum and electromagnetic interference because they don’t provide the common-mode noise rejection of a balanced connection. To isolate the fault, power down equipment before reconnecting anything, then test the microphone and recorder separately. Keep the cable short and route it away from power supplies, lighting, and mains leads.
- Substitute a known-good cable and connector; a defective shield or contact can inject hum.
- Reposition the run away from transformers, dimmers, chargers, and electrical devices.
- Use balanced XLR when both microphone and input support it; dynamic capsules don’t inherently reject cable-borne interference.
- For an unbalanced output feeding a balanced input, install a suitable transformer or audio interface, not a simple adapter that preserves the noise path and ground coupling.
Confirm 180° Rear Rejection
To confirm 180° rear rejection, compare the polar plot’s response at the rear axis with its normalized 0° on-axis level. Read 180° as sound arriving directly behind the microphone, then measure its attenuation against the 0 dB reference. Plot rings commonly indicate 5 dB increments.
- For cardioid patterns, expect roughly −6 dB at ±90°, but derive 180° rejection from the published plot.
- Don’t assume a deeper rear null: supercardioids retain rear pickup, with nulls near ±135°.
- Hypercardioid nulls occur near ±115°, so 180° may show measurable sensitivity.
- Inspect each frequency trace; rear response often changes across the operating band.
Record the value in decibels, and use the worst-frequency result when you estimate isolation from monitors, reflections, or performers positioned behind the capsule during use.
Conclusion
You’ll select microphones more reliably when you compare 1 kHz sensitivity in consistent units, relate self-noise to the quietest source, and reserve adequate maximum-SPL headroom for close drums and loud instruments. You’ll also verify phantom-power, pad, and cable requirements before tracking. Test rear rejection at 180°, then diagnose hum as a balance or grounding fault. By reading frequency-response curves alongside these limits, you can predict gain, noise, overload, and tonal behavior before recording with confidence.